Cheat sheet: 10 funnel metrics to track first, and when to read them
Teams often end up in one of two places. Either nobody is sure what to track, or the dashboard holds forty metrics in no particular order. In both cases, nobody knows which number to look at on Monday, or when a change can be judged.
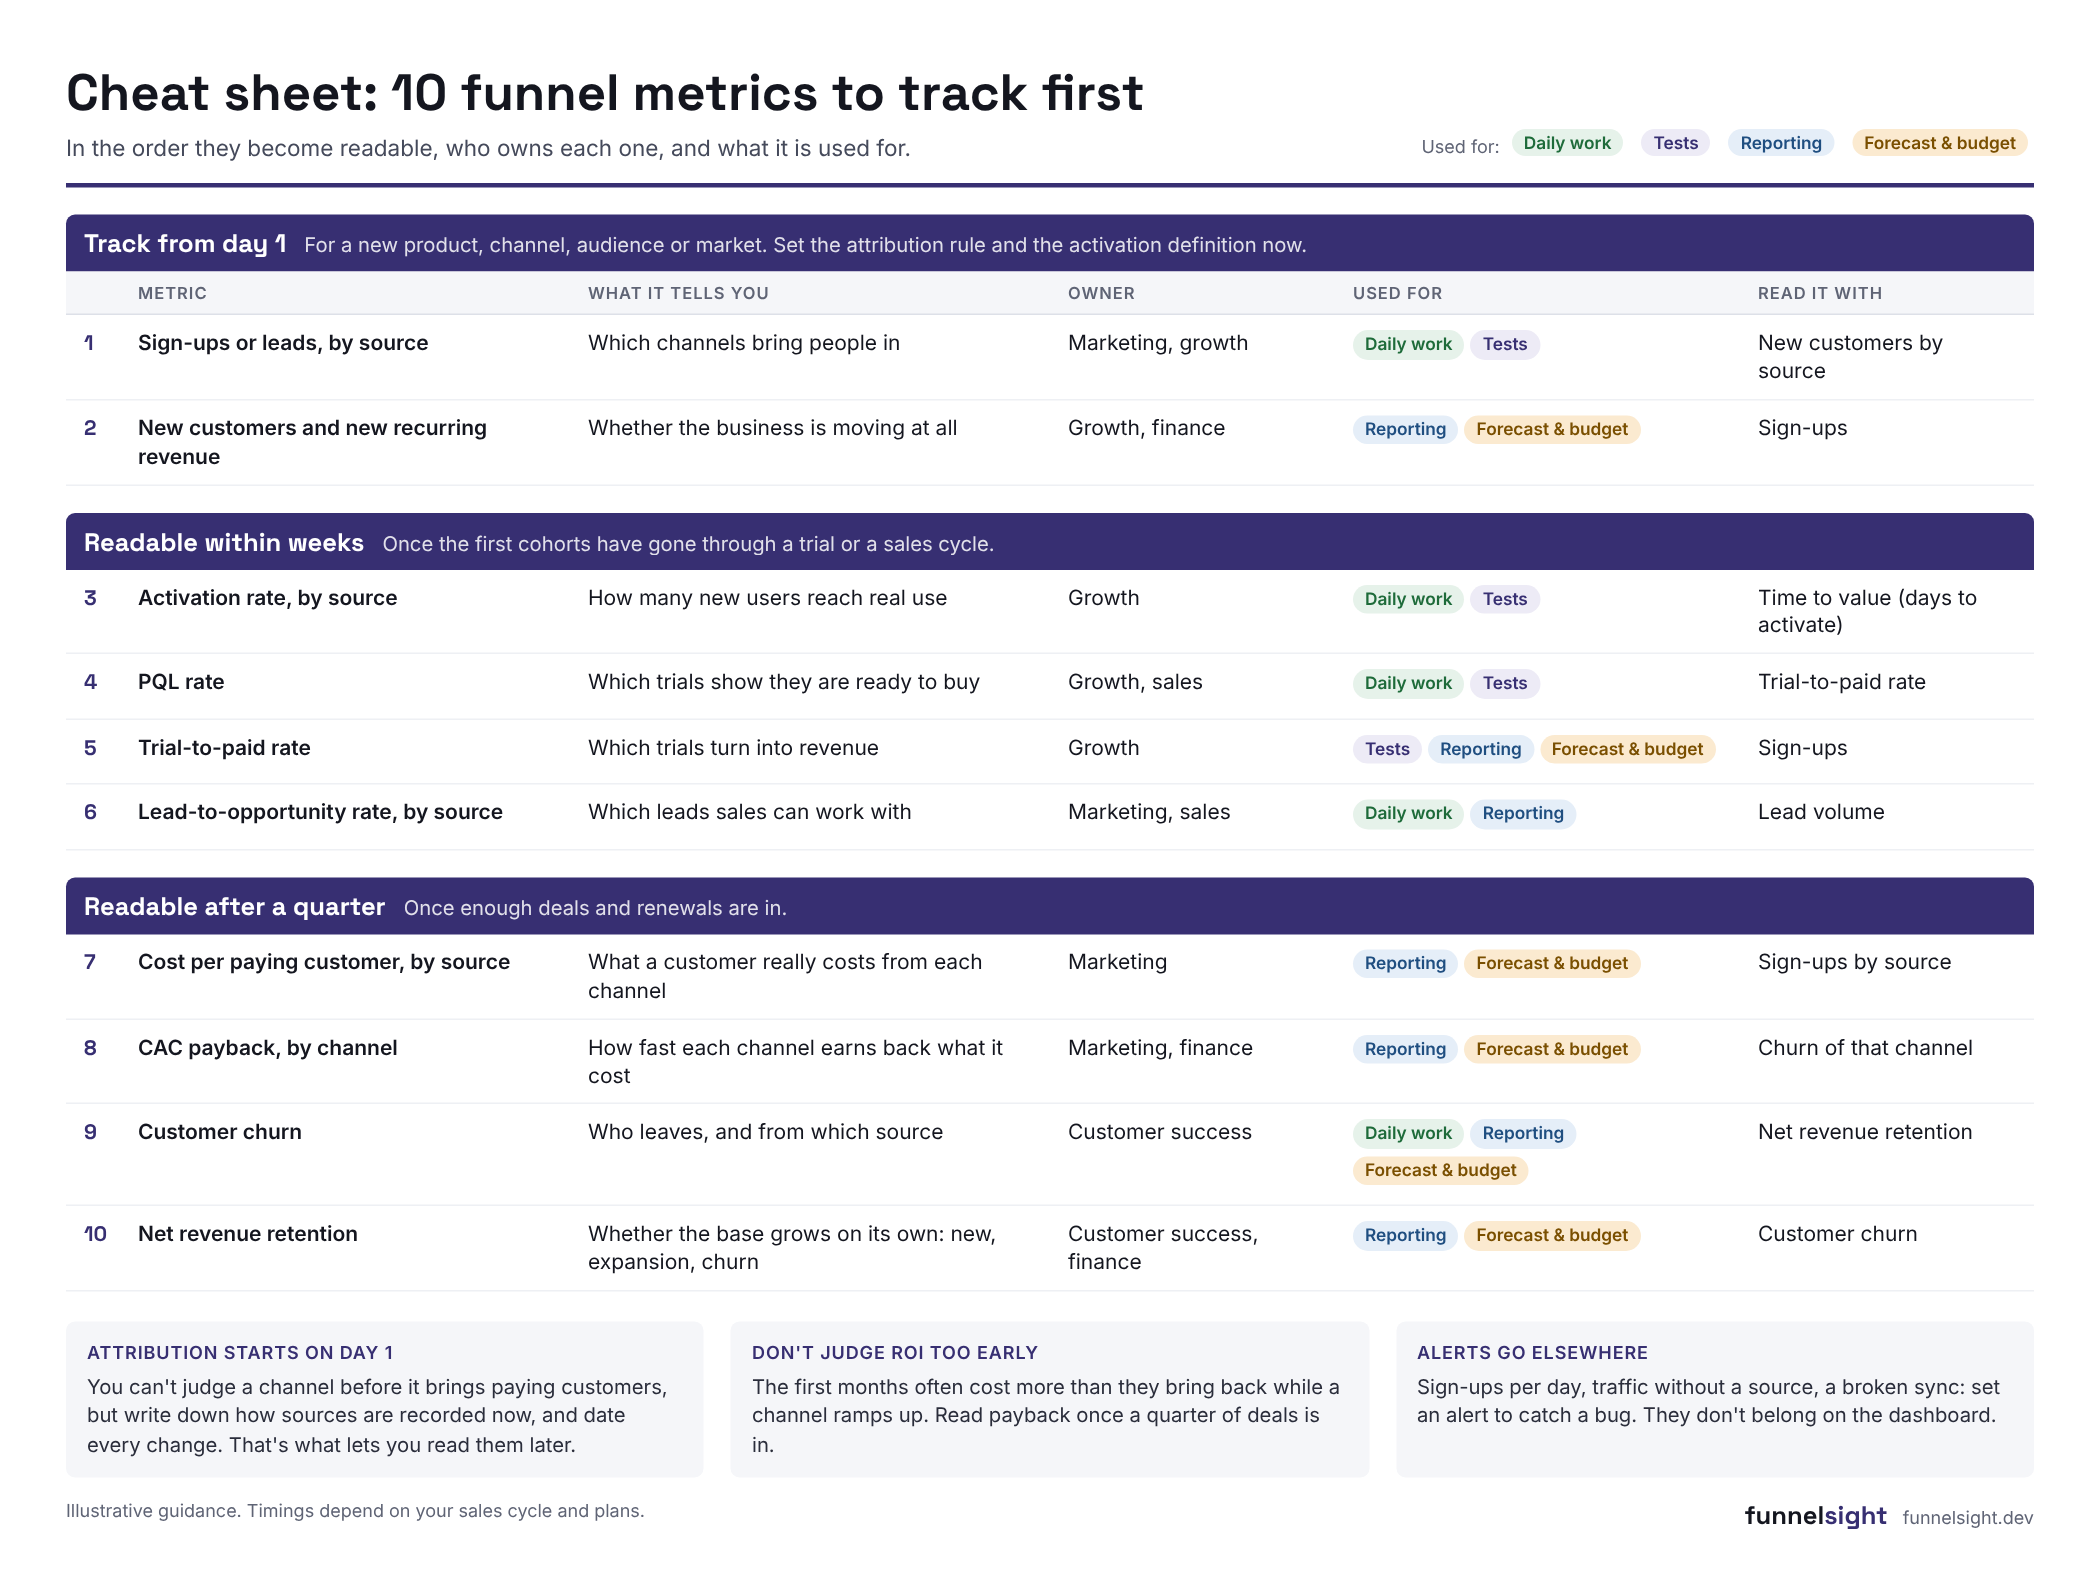
This cheat sheet sorts ten funnel metrics by when they become readable, who owns each one and what it's used for. It works for a new product, and just as well for a new channel, a new audience or a new market.
The cheat sheet
Track from day 1 For a new product, channel, audience or market. Set the attribution rule and the activation definition now.
| Number | Metric | What it tells you | Owner | Used for | Read it with |
|---|---|---|---|---|---|
| 1 | Sign-ups or leads, by source | Which channels bring people in | Marketing, growth | Daily workTests | New customers by source |
| 2 | New customers and new recurring revenue | Whether the business is moving at all | Growth, finance | ReportingForecast & budget | Sign-ups |
Readable within weeks Once the first cohorts have gone through a trial or a sales cycle.
| Number | Metric | What it tells you | Owner | Used for | Read it with |
|---|---|---|---|---|---|
| 3 | Activation rate, by source | How many new users reach real use | Growth | Daily workTests | Time to value (days to activate) |
| 4 | PQL rate | Which trials show they are ready to buy | Growth, sales | Daily workTests | Trial-to-paid rate |
| 5 | Trial-to-paid rate | Which trials turn into revenue | Growth | TestsReportingForecast & budget | Sign-ups |
| 6 | Lead-to-opportunity rate, by source | Which leads sales can work with | Marketing, sales | Daily workReporting | Lead volume |
Readable after a quarter Once enough deals and renewals are in.
| Number | Metric | What it tells you | Owner | Used for | Read it with |
|---|---|---|---|---|---|
| 7 | Cost per paying customer, by source | What a customer really costs from each channel | Marketing | ReportingForecast & budget | Sign-ups by source |
| 8 | CAC payback, by channel | How fast each channel earns back what it cost | Marketing, finance | ReportingForecast & budget | Churn of that channel |
| 9 | Customer churn | Who leaves, and from which source | Customer success | Daily workReportingForecast & budget | Net revenue retention |
| 10 | Net revenue retention | Whether the base grows on its own: new, expansion, churn | Customer success, finance | ReportingForecast & budget | Customer churn |
How to read it
The three blocks follow the time each metric needs. Sign-ups by source mean something on day one. Trial-to-paid needs at least one full trial. Churn and payback need a quarter of deals.
"Used for" separates four needs. Daily work is what a team acts on during the week. Tests tell you whether a change worked. Reporting goes into a quarterly review or a leadership update. Forecast and budget is what finance plans with. A metric can serve several of them, but no one needs all ten at the same pace. Leadership doesn't need sign-ups per day, and a growth team can't steer its week on net revenue retention.
Activation and PQL are easy to confuse. Activation means a new user has done once what they came for. A PQL means their usage shows they're more likely to buy than the average user. Time to value comes from the same event as activation: the number of days it took to get there.
What to set up before you can read anything
Most of these numbers are already collected somewhere, so there's no need to start from scratch. Traffic and on-page conversion are in Google Analytics and Search Console. Sign-ups, activation and PQLs are in the product's own data. MQLs, nurturing and lead-to-opportunity are in the marketing automation tool and the CRM. Trial-to-paid, churn and revenue are in billing or the CRM. What's usually missing is the link between them, and a few written rules.
You can't judge a channel before it brings paying customers. But if its sources aren't recorded the same way from the first day, you won't be able to judge it when they come. Write down which touch counts and how each source is named, and the date of each change. Do the same for the activation event.
Expect the first months of a channel to cost more than they bring back while it ramps up. A payback read after three weeks says more about the timing than about the channel.
How long before a change shows up
Every change has its own delay. Launch paid search on Monday, and sign-ups from it show the same day. Whether those users activate shows within a few days. Send a webinar invitation and most registrations arrive within 48 hours. Rewrite an SEO page and you may wait weeks.
- Traffic from paid, email or socialRight away
- Conversion on the page (visit to sign-up or form)Within a day
- Activation rateWithin the first days
- Trial-to-paid, change during the trialAs running trials reach the purchase step
- PQL rateAround the end of the first week
- MQL rateAfter a few marketing touches. Demo and contact requests show right away
- Trial-to-paid, change for new sign-ups onlyAfter one full trial, for those who signed up after the change
- Lead-to-opportunity rateAfter one follow-up cycle
- Traffic from SEOWeeks to months
- Revenue, churn and net revenue retentionAfter a quarter or a renewal cycle
Three things change the delay. The first is where the change happens. A new prompt or offer during the trial reaches trials that are already running, so trial-to-paid moves within days. A change before sign-up only reaches people who sign up after it, so you wait one full trial. Even then, users who are already convinced often keep their 14 free days before they pay.
The second is volume. A new third email in a nurturing sequence, or a new step in a sales sequence, only shows once enough people have reached it.
The third is the window you compare. A change made on the 25th barely shows in that month's figures, and one week of effect gets lost in a quarter. Start the comparison on the day of the change, and compare the people who came after it with those who came just before.
Three traps when you build the dashboard
- Alerts on the dashboard. Sign-ups per day, traffic without a source or a broken sync are there to catch a bug. Set an alert for them and keep them off the dashboard.
- A strategic metric read every week. Net revenue retention moves with renewals. Read weekly, it mostly shows noise.
- One average for every source. A blended activation rate can stay flat while one source improves and another drops. Read the first six metrics by source.
What the dashboard needs to show
To follow this order without rebuilding the numbers each month, a dashboard needs four things. Each volume metric next to the one that completes it, such as sign-ups next to cost per paying customer. Each channel read on its own timeline, paid search over days and SEO over months. A dated note on the day of each change. And one definition of each metric, used in every view, as in a single source of truth.
Funnelsight is built around those four points, with acquisition, product usage, CRM and billing in one view of the funnel.
See your funnel metrics in the order they become readable, source by source.
Start free trialWhat are the most important SaaS metrics?
Finance teams usually start with recurring revenue, churn and net revenue retention. For marketing and growth teams, the useful starting set sits earlier in the funnel: sign-ups by source, activation, PQL or lead-to-opportunity rate, and trial-to-paid. Revenue metrics follow once enough deals are in.
What are funnel metrics?
Funnel metrics measure how people move from one stage of the journey to the next, such as visit to sign-up or trial to paid, and how long that takes. Read by source, they show which channels bring people who go further, not just more people.